> ## Documentation Index
> Fetch the complete documentation index at: https://docs.tqx.ai/llms.txt
> Use this file to discover all available pages before exploring further.
# Run a backtest
> Run a historical simulation for a saved strategy version and inspect the evidence.
A backtest runs one saved strategy version over a historical period. The run stores the exact parameters, metrics, equity curve, trades, and log so you can review the result later.
## Before you start
* Save the strategy code and parameters.
* Confirm the strategy market and symbols.
* Choose a period that is long enough to cover the intended behavior.
* Decide whether daily (`1d`) or minute (`1M`) data matches the signal.
## Run the simulation
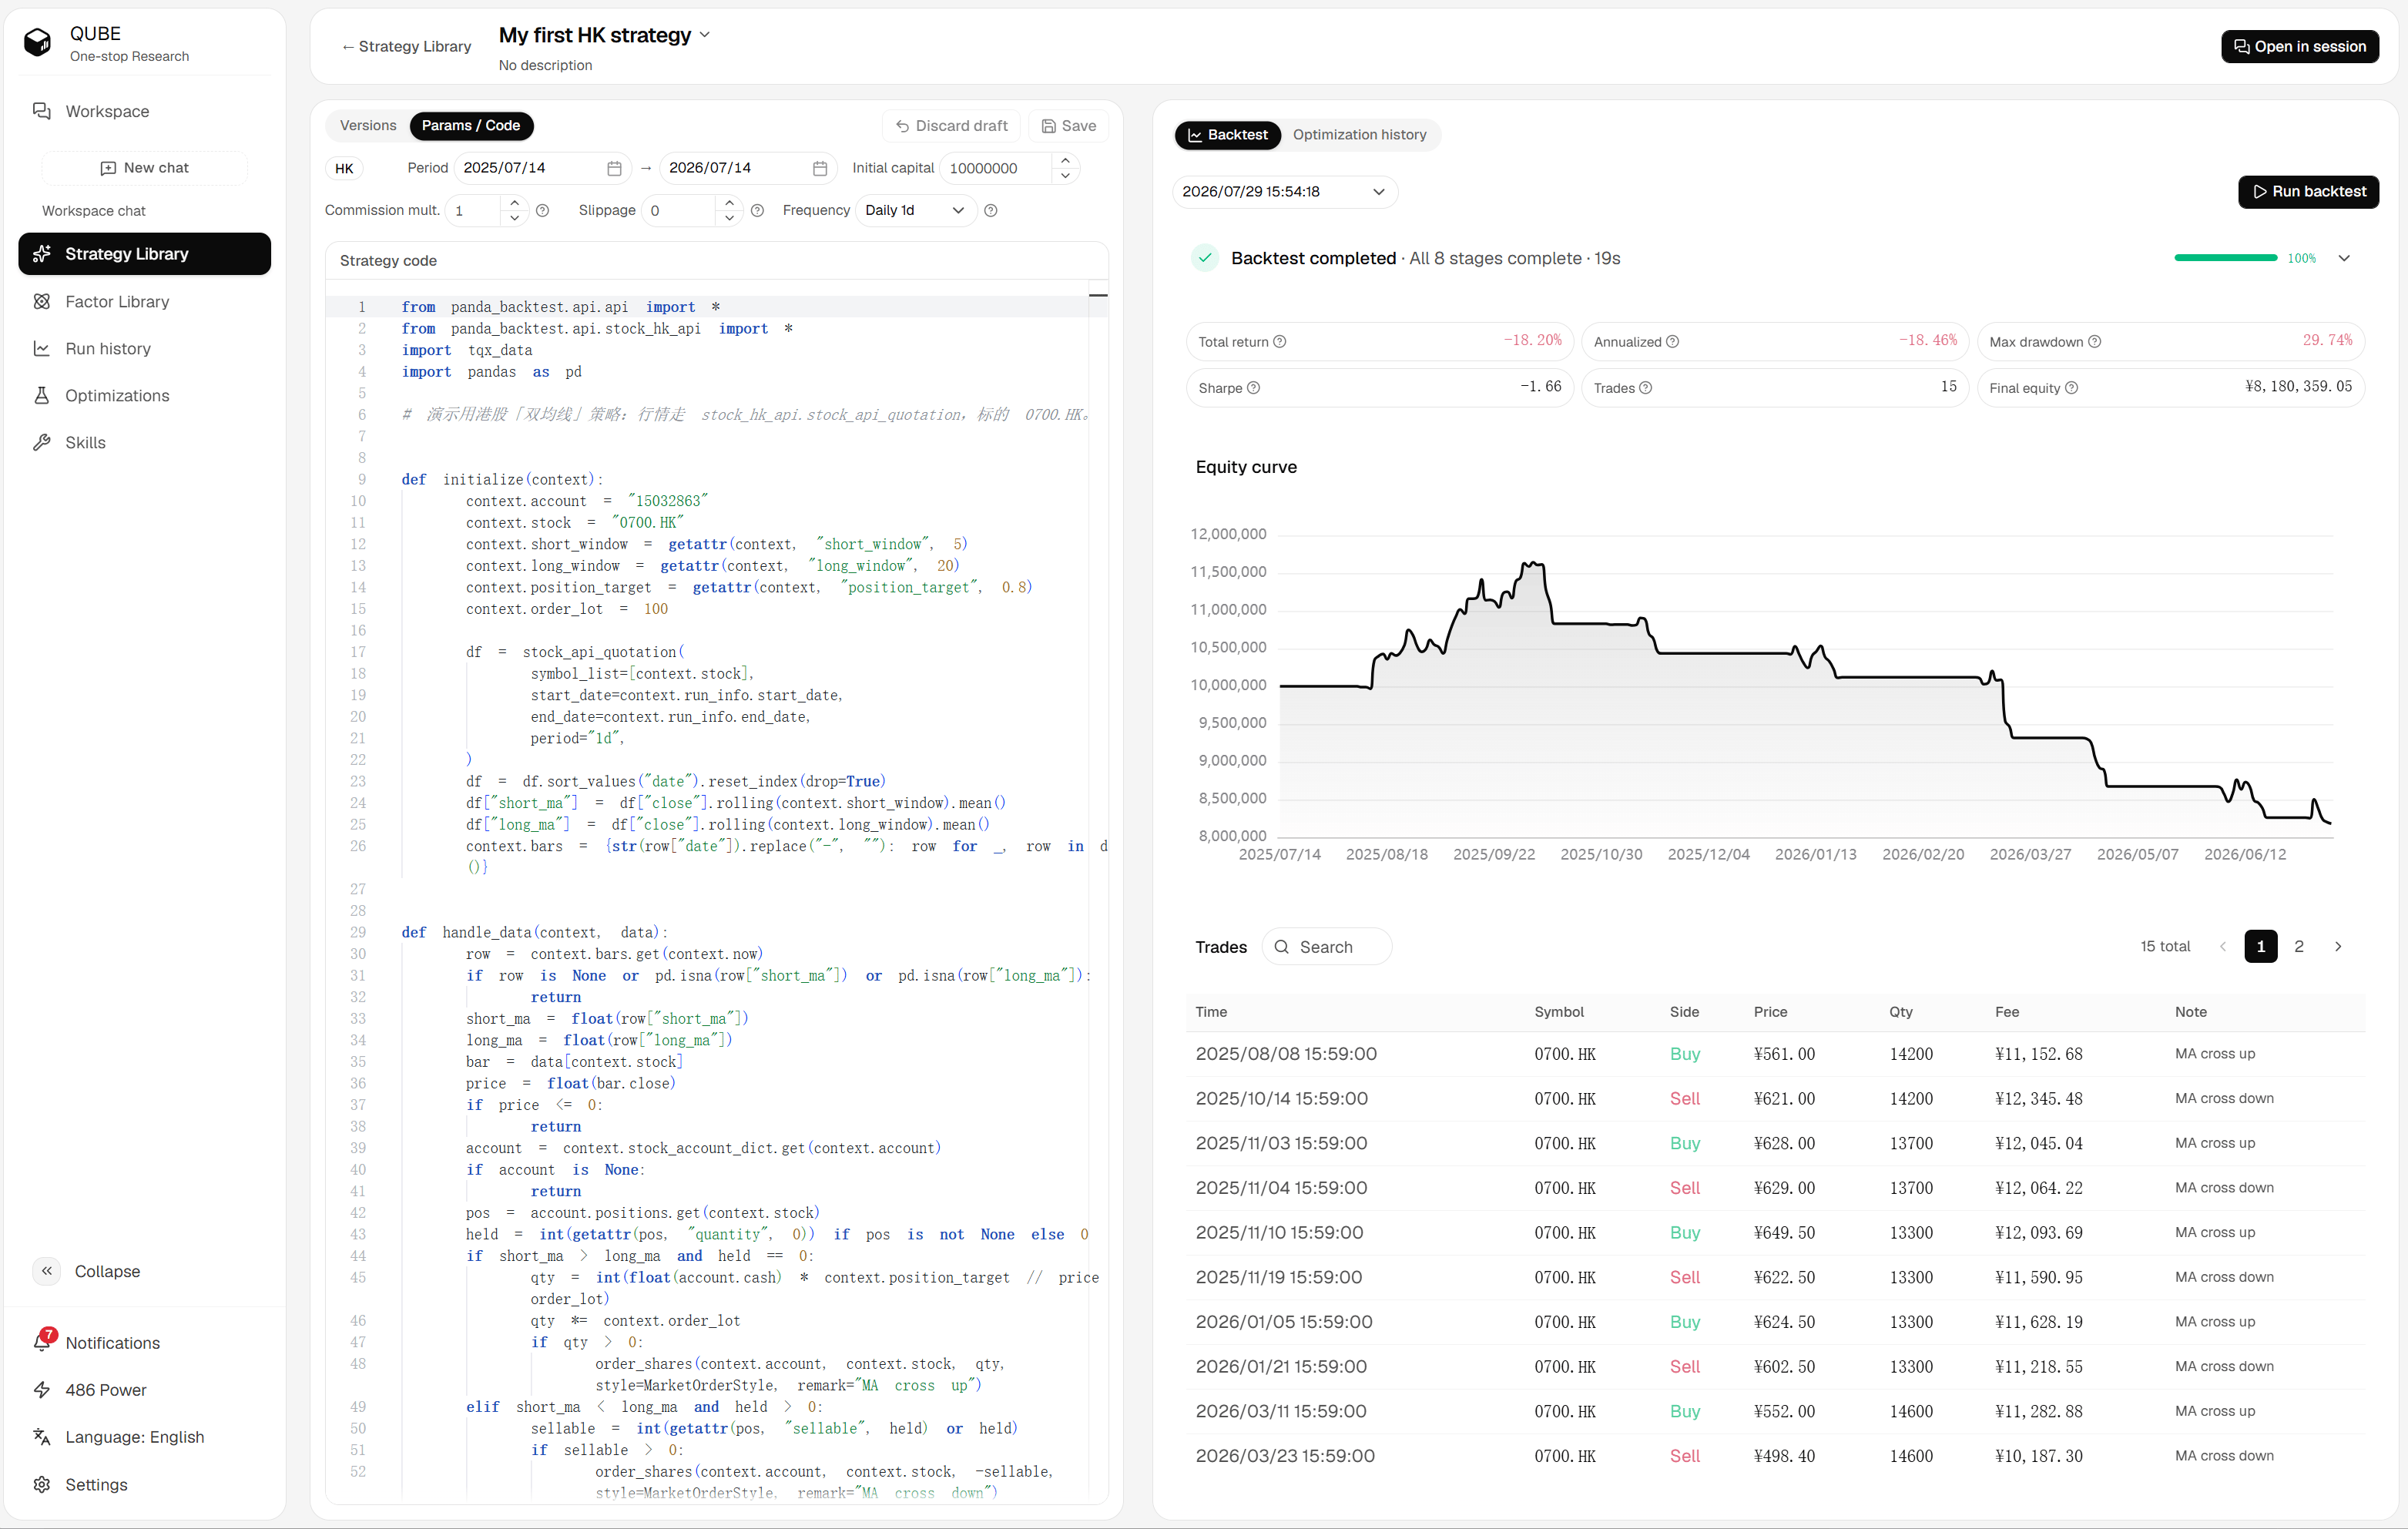
Open the strategy detail page and select the version you want to test. A run remains linked to this version even when the strategy changes later.
Set the period, initial capital, commission multiplier, slippage, frequency, and benchmark.
Click **Run backtest** or ask Qube to run the selected strategy. Qube streams progress and keeps the run in the strategy's run history.
Read the key metrics first, then inspect the equity curve, trade details, and strategy log. Use the failure details to fix code or data assumptions before rerunning.
 ## Parameters
| Parameter | What it controls |
| --------------------- | ------------------------------------------------------------------------- |
| Period | The historical start and end dates. |
| Initial capital | The starting account equity for the simulation. |
| Commission multiplier | A multiplier applied to the market's base commission schedule. |
| Slippage | The price or tick adjustment applied to simulated orders. |
| Frequency | Daily bars (`1d`) or minute bars (`1M`). Minute runs usually take longer. |
| Benchmark | The comparison index for supported stock markets. |
If you do not specify a field, Qube uses the current market defaults. Keep the saved parameters with the version when you need a reproducible comparison.
## Continue
* [Read run history](/research/run-history)
* [Compare strategy versions](/research/strategy/versions)
* [Optimize parameters](/research/strategy/optimization)
## Parameters
| Parameter | What it controls |
| --------------------- | ------------------------------------------------------------------------- |
| Period | The historical start and end dates. |
| Initial capital | The starting account equity for the simulation. |
| Commission multiplier | A multiplier applied to the market's base commission schedule. |
| Slippage | The price or tick adjustment applied to simulated orders. |
| Frequency | Daily bars (`1d`) or minute bars (`1M`). Minute runs usually take longer. |
| Benchmark | The comparison index for supported stock markets. |
If you do not specify a field, Qube uses the current market defaults. Keep the saved parameters with the version when you need a reproducible comparison.
## Continue
* [Read run history](/research/run-history)
* [Compare strategy versions](/research/strategy/versions)
* [Optimize parameters](/research/strategy/optimization)